Java™ Virtual Machine Tool Interface

Tightly monitor your application using the JVM Tool Interface.
The Java Virtual Machine Tool Interface (JVM TI) is a low-level programming interface which allows the user to create agents, which can monitor and even control Java applications. It is an optional interface and a Java Virtual Machine (JVM) implementation is not required to provide an implementation for it. The HotSpot JVM, implemented by the OpenJDK project, has an implementation for this interface. One of the most used JVM TI agents might be jdwp, the Java Debug Wire Protocol agent, with which one can debug Java applications. Apart from debuggers, profilers and monitoring tools are two other types of agents for which this interface is designed for.
A JVM TI agent is a native library, mostly implemented in C or C++, which is linked with the JVM during runtime. The agent therefore runs in the same process as the JVM and the Java application it is attached to. The JVM can notify the agent about certain occurrences through events. While reacting to those events, the agent can request certain information from the JVM through the JVM TI or the Java Native Interface (JNI). Since agents are written in C or C++, they can utilize operating system APIs as needed and can communicate with other processes, or other systems over a network.
The events generated by the JVM and forwarded to the JVM TI agent cover a wide variety of different types. There are events for simple occurrences, like those informing the agent about the finished initialization of the JVM, or about the termination of it. Others allow a very close monitoring of the running application. The agent can be notified if a certain breakpoint got hit, or a certain field of an object is accessed or is about to be modified. It is even possible to manipulate the running application. Events are generated when a class file is loaded. Agents listening for these events can then change the bytecode of the class and inject code into the running Java application.
Besides getting notified through events, a JVM TI agent can also instruct the JVM to do certain operations. One of those is off course the registration for the events to be received and the configuration of them. But besides that, there are many other operations the JVM can perform on behalf of the agent. This includes tasks such as forcing a garbage collection, which reduces the number of life objects inside the Java heap. Doing that might be useful in preparation for walking the Java heap, which is also a task the agent can instruct the JVM to perform. Another exemplary task would be the installation of additional class loader search paths. This functionality can be used to instrument and manipulate the running Java application by replacing certain classes using the class loader search paths without the need to manipulate classes on a bytecode level.
It is also possible to communicate with a JVM TI agent from within the Java application by using JNI. Since both, JVM TI and JNI are native interfaces, a native library can utilize both at the same time. The JVM can then load the native library as a JVM TI agent and attach it to the JVM. Exported JNI functions from the shared library are also visible to the JVM and can be called from within the Java application. This makes it possible to configure a JVM TI agent from the Java application.
Because the JVM TI allows the agent to monitor the application very tightly, doing so might have a negative performance impact on the application. Many events are delivered synchronously to the JVM TI agent and are processed in the same Java thread which triggered the event condition. Doing heavy work in the agent might have a negative impact on the running application. Also, it might no longer be possible for the JVM to optimize the running Java application as needed. Having a breakpoint in a Java method might make it impossible for the Just-in-time compiler of the JVM to compile or optimize that method. This makes the interface not ideal to be used in production for monitoring purposes. It should be used to aid during development and to help identifying and understanding bugs, or monitor during the test or integration phase of a Java application.
Stay Connected
Everything On Graal VM
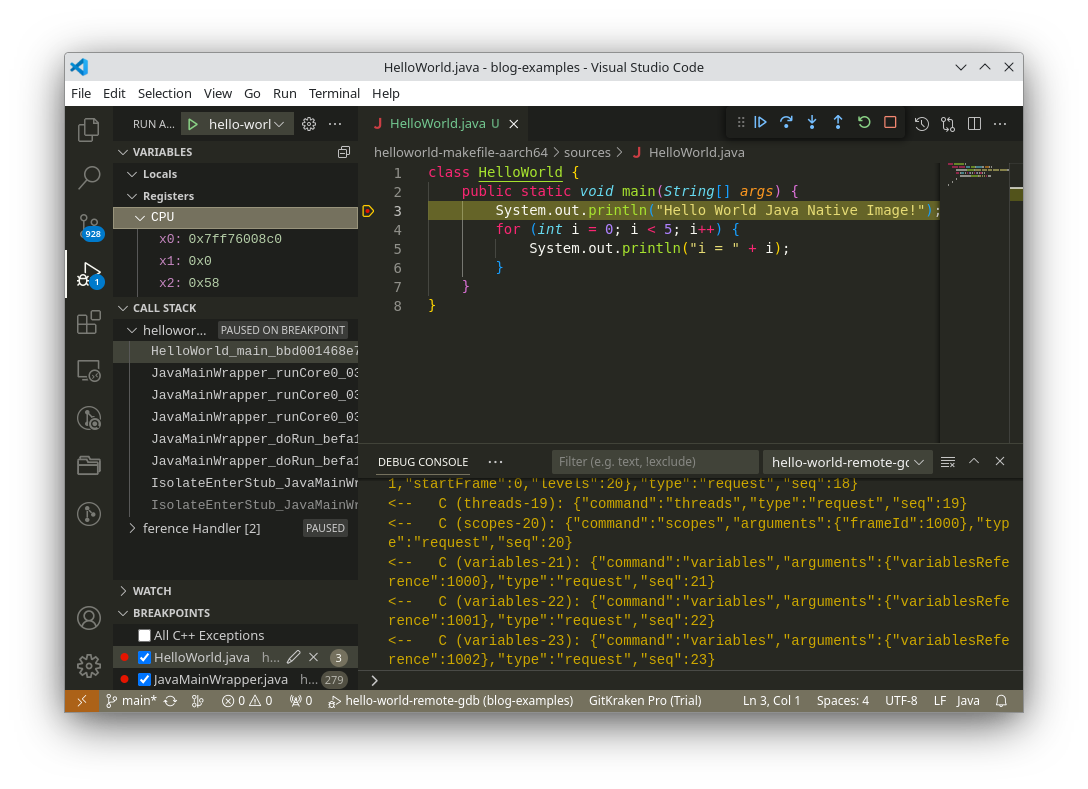
We illustrate how to build and debug the native image of a Java application, produced by MicroDoc GraalVM Embedded, and running on a remote embedded device. The debugging experience is illustrated inside the VSCode IDE. The embedded device runs Linux on an ARMv8-A processor (running in AArch64 mode), like a RaspberryPi 4 or 5.

For devices that are not powerful enough to run a full feature browser or Android system, MicroDoc is developing a user interface framework directly integrated with the Graal virtual machine. Why? Because the number of small devices is increasing dramatically, and although they may be small and low powered they still deserve an up-to-date user interface.

Would it be fair to say that the GraalVM is a step closer to the holy grail of polyglot programming? Yes, according to the virtual machine experts from MicroDoc. Here’s an overview of what the GraalVM can do for software developers.